Open /portal/chart.html, load your symbol, and trade directly from the chart while watching
stacked indicator context. Entries, stop movement, and position management happen without leaving chart view.
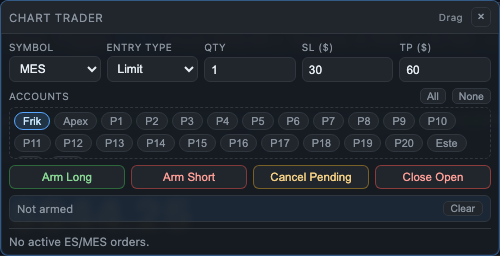
On-Chart ExecutionTrade and manage without context switching
Indicator StackTrend, volume, and level overlays in one chart
Fast Order ControlMove SL/TP and stage stops from chart context
RTH & Extended ViewsSwitch session scope for cleaner structure reads
Crystal: Not IncludedBronze: Not IncludedSilver: Not IncludedGold: Included
Enter long or short while watching structure, levels, and momentum
Monitor active position state without losing chart focus
Use bracket-style management patterns directly around the active trade
Keep execution timing aligned with live candle behavior
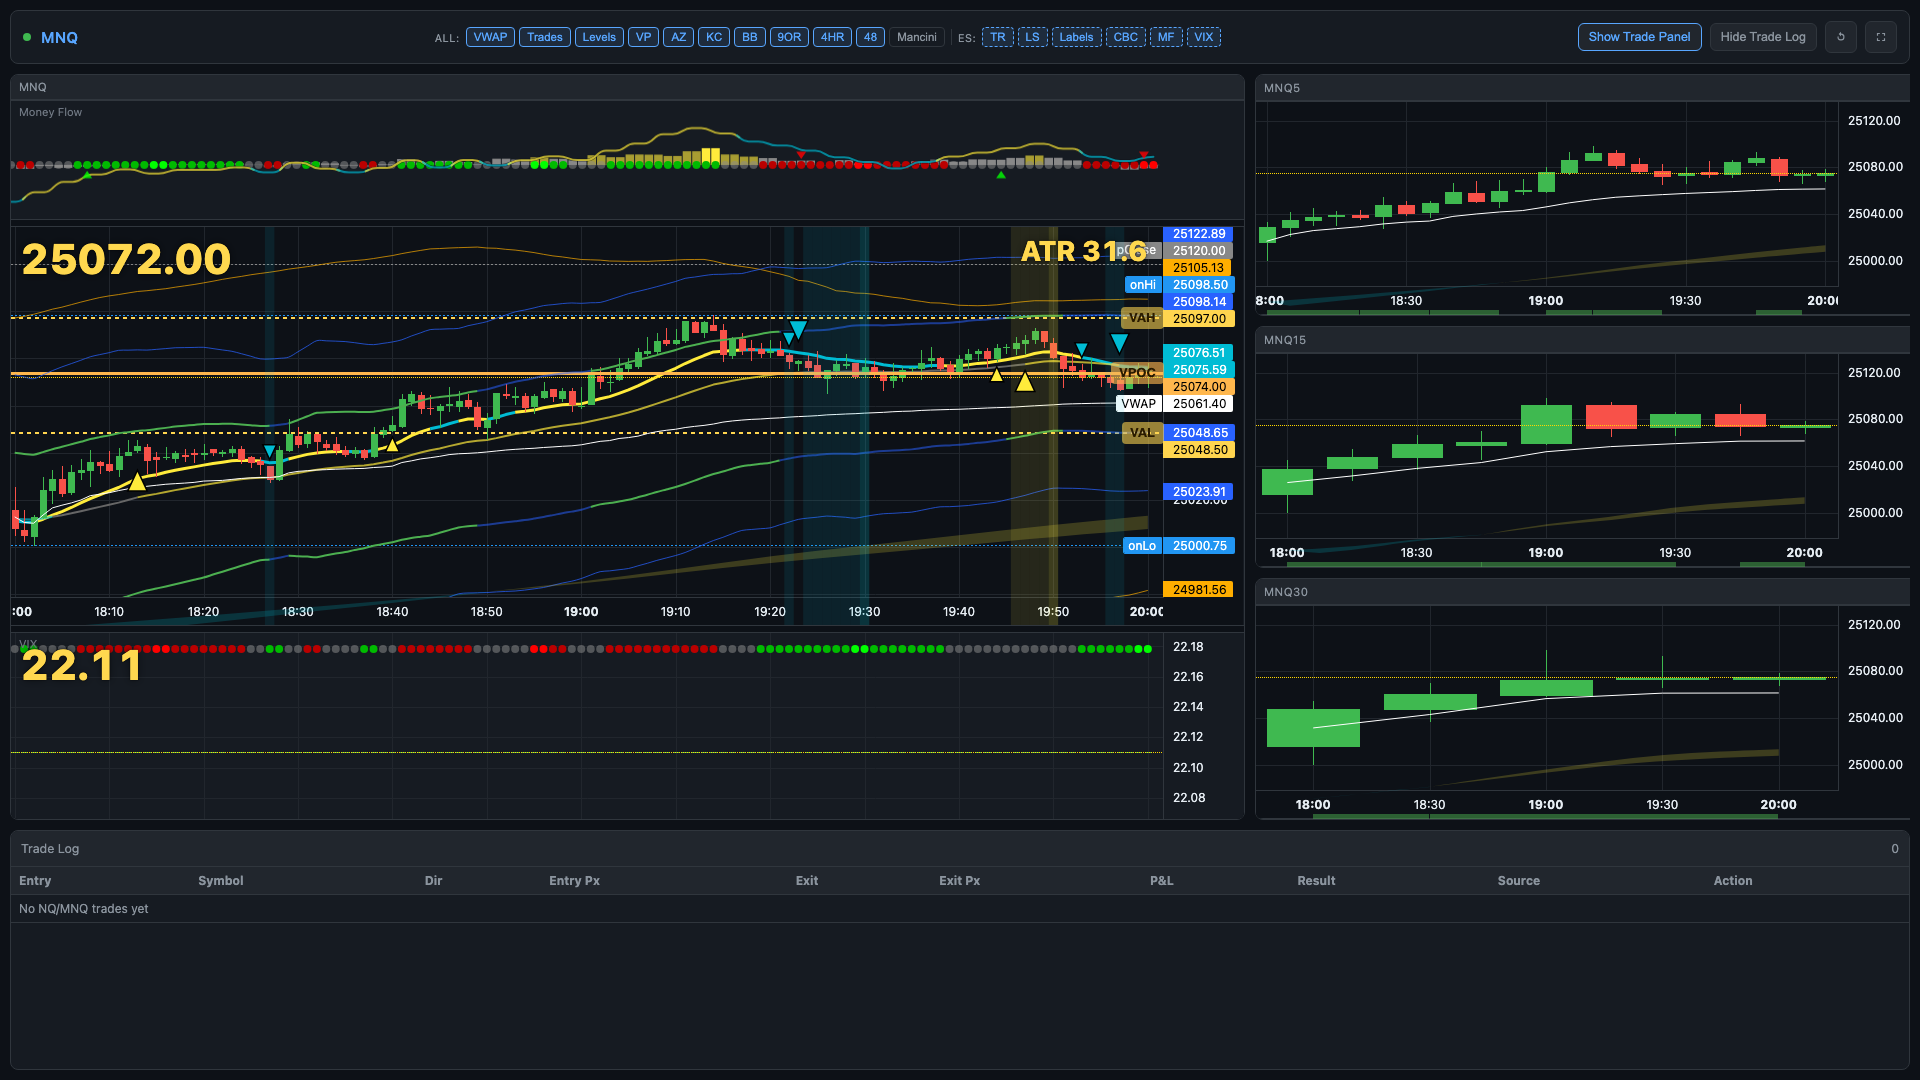
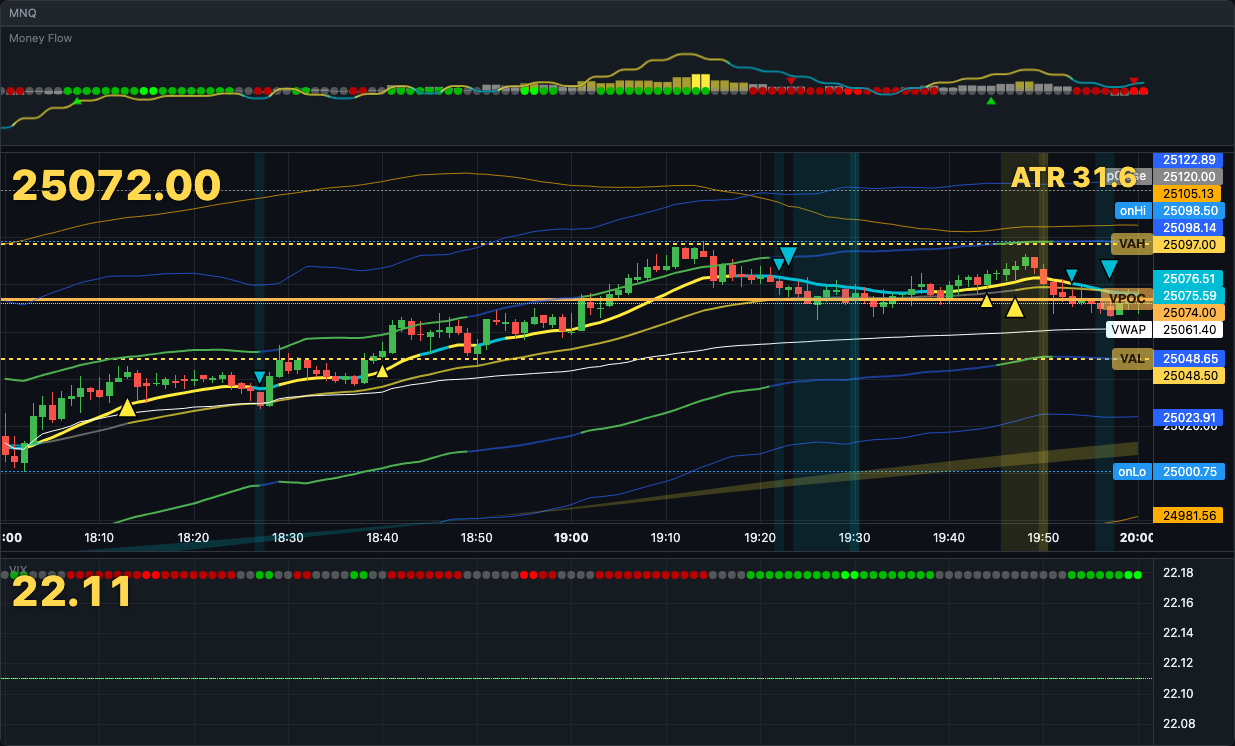
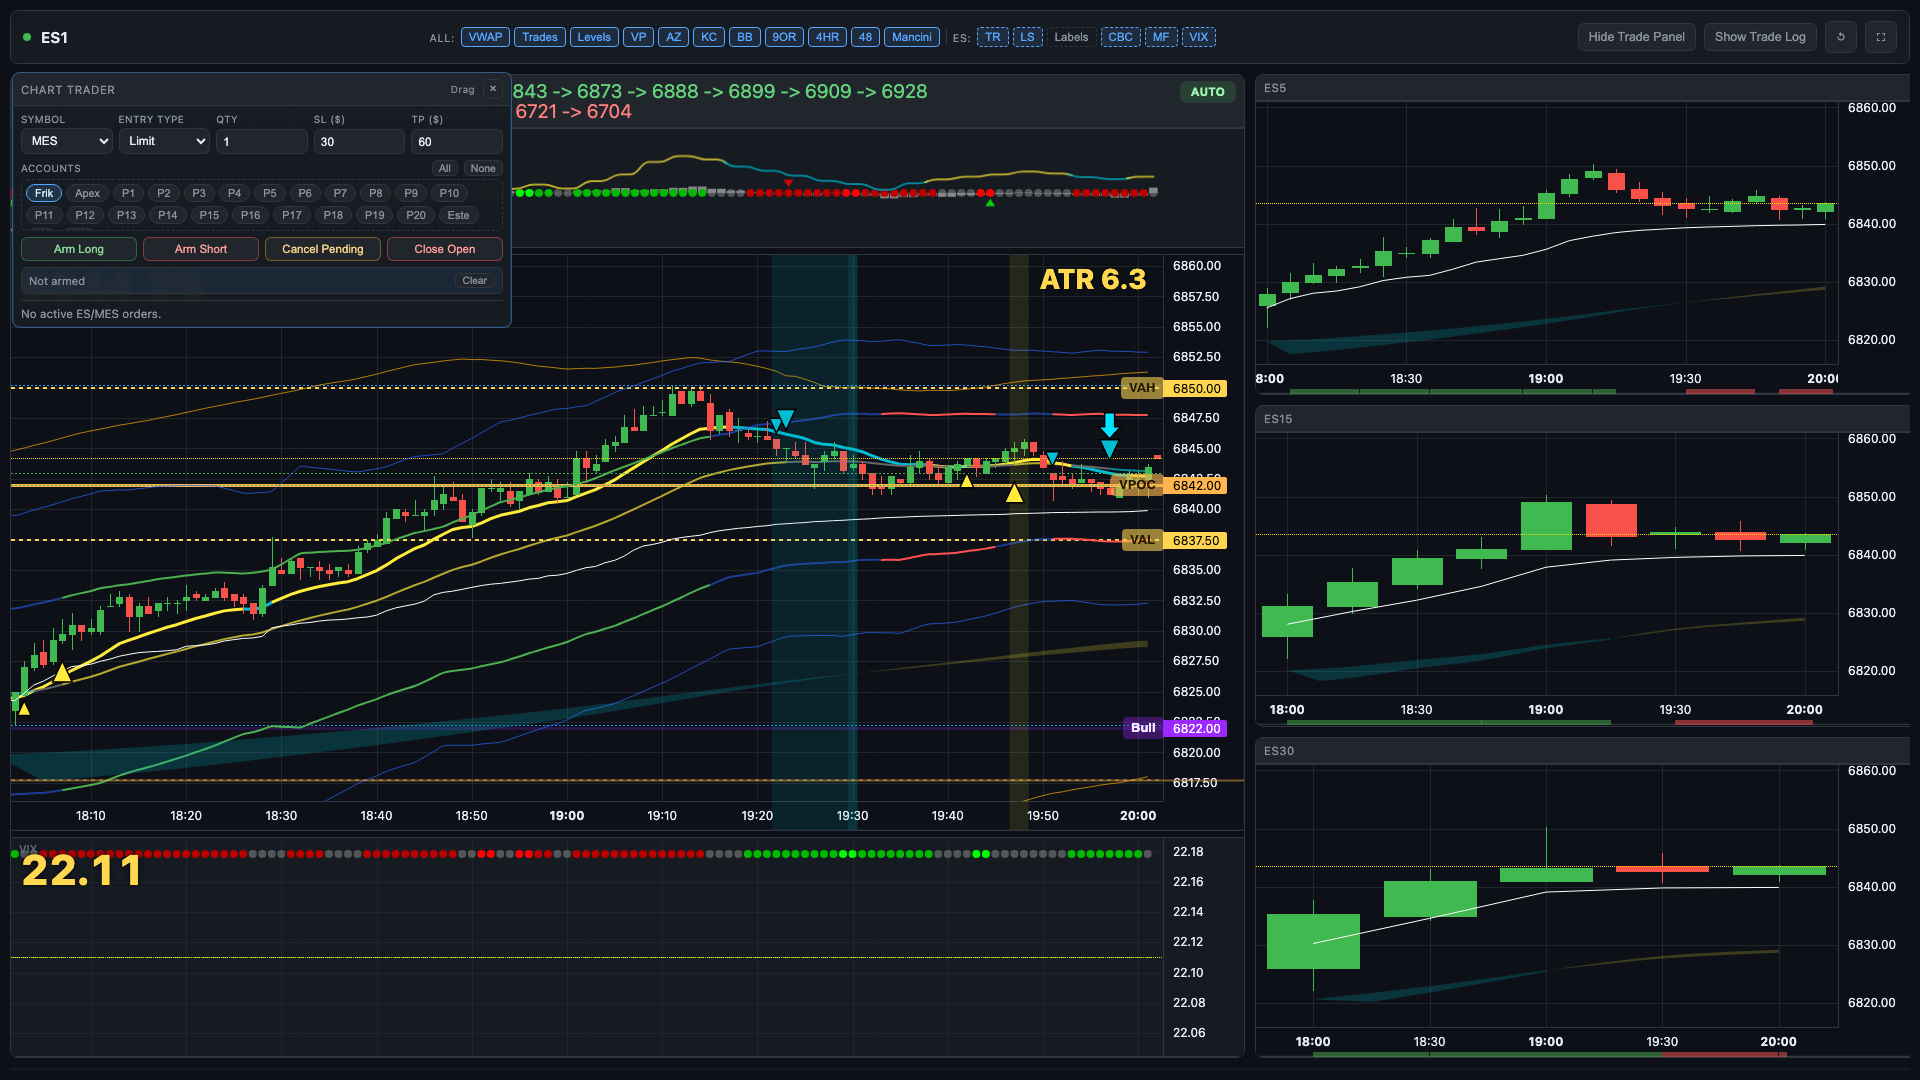
Indicator + Overlay Stack
Multi-indicator context layered on one chart view
Session-aware reading for intraday decisions
Layered visual cues for momentum and exhaustion
FlowPulse and chart controls stay in the same workflow
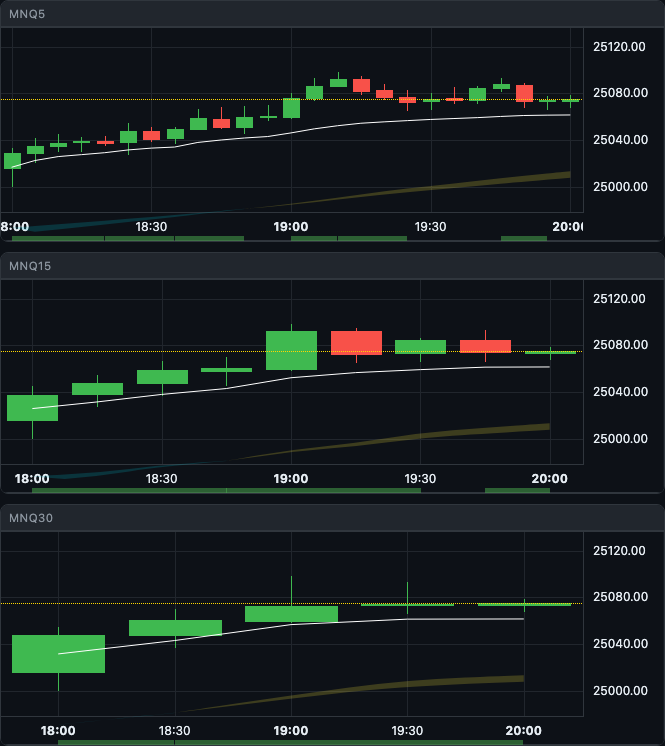
Multi-Timeframe Panel Layout
Right-column timeframe stack: 5m, 15m, 30m alongside the main chart
Coordinate entry timing across multiple chart horizons
Spot higher-timeframe context without switching windows
Collapse trade panel to maximize chart real estate
Session + View Switching
Toggle between RTH and extended session scope
Switch symbols without leaving the chart workflow
Enable or disable indicator label overlays per session
Mancini level display toggled directly from chart controls
Use RTH During the Day for Cleaner Structure
Switching the chart to RTH while the market is active gives you stronger structure, cleaner
rotations, and more obvious reaction zones than the extended session drift. For live trading,
RTH scope is the recommended default during regular hours.
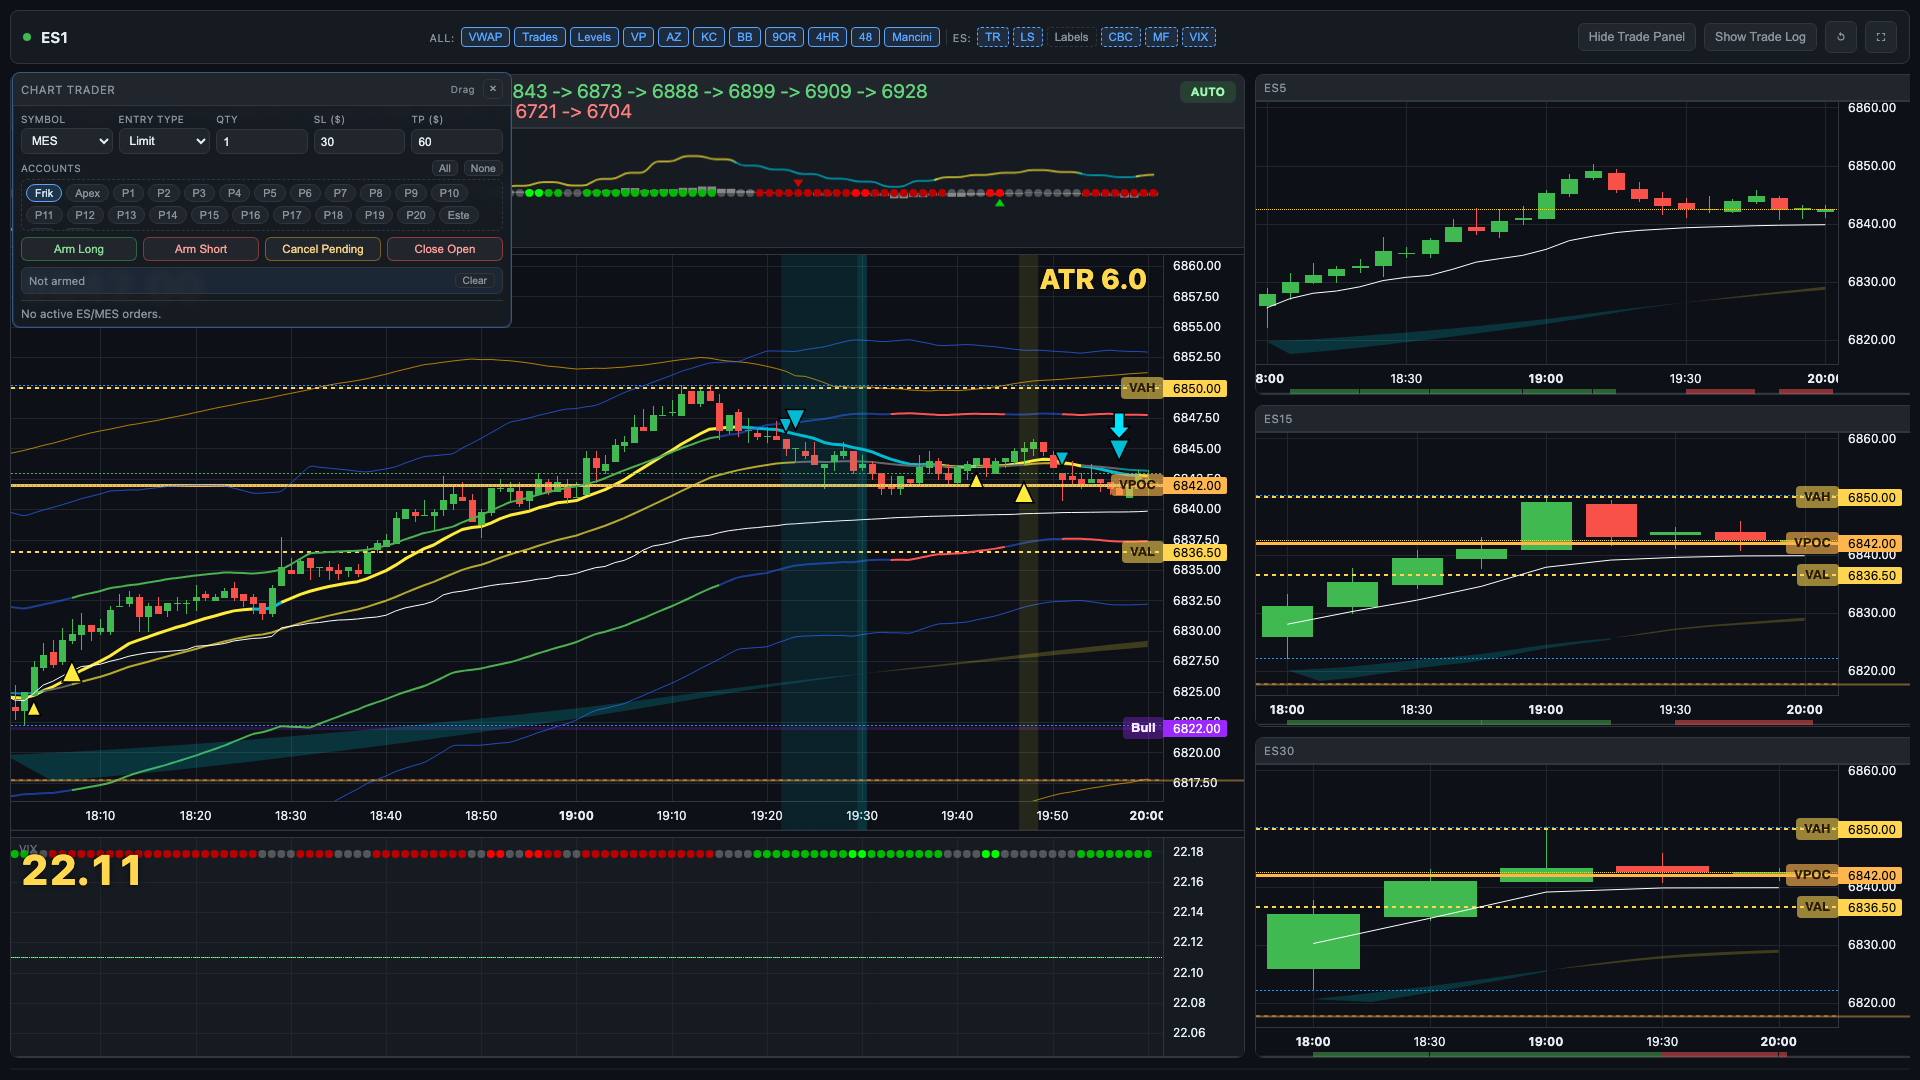
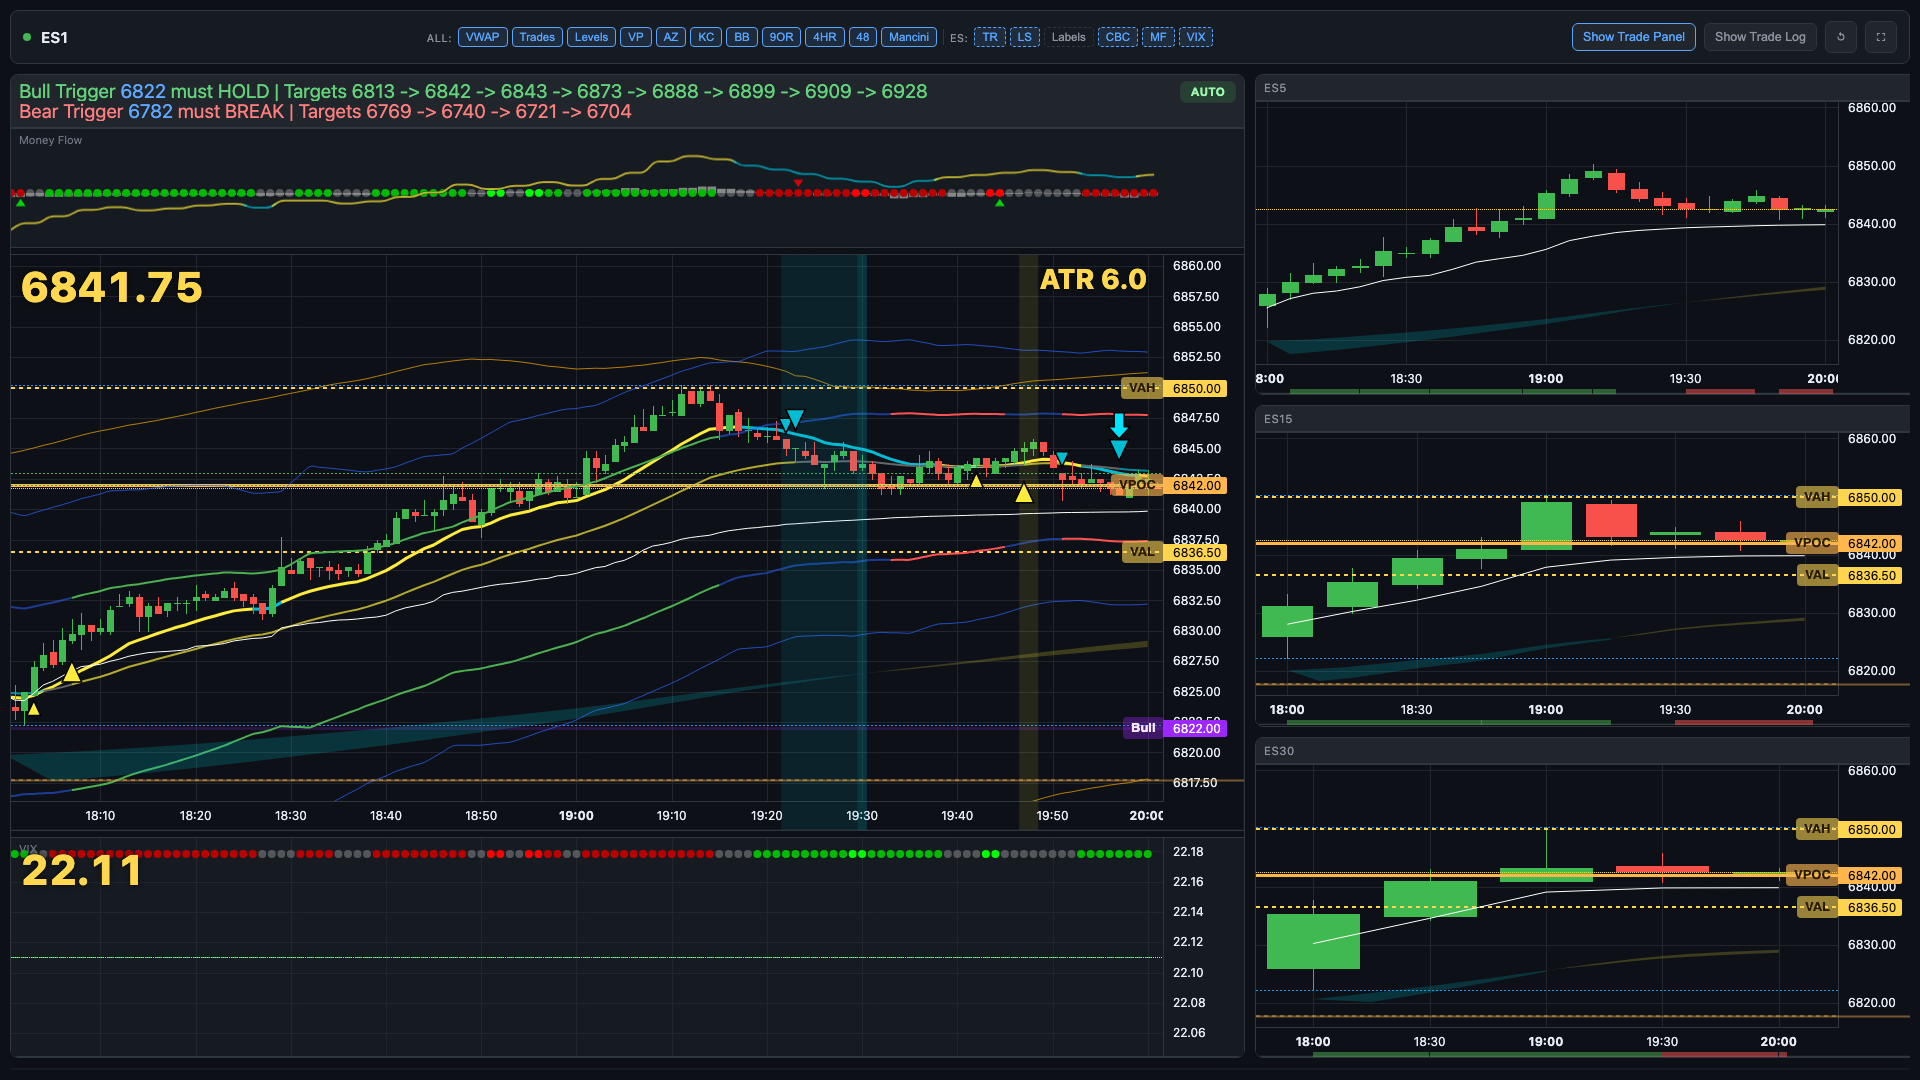
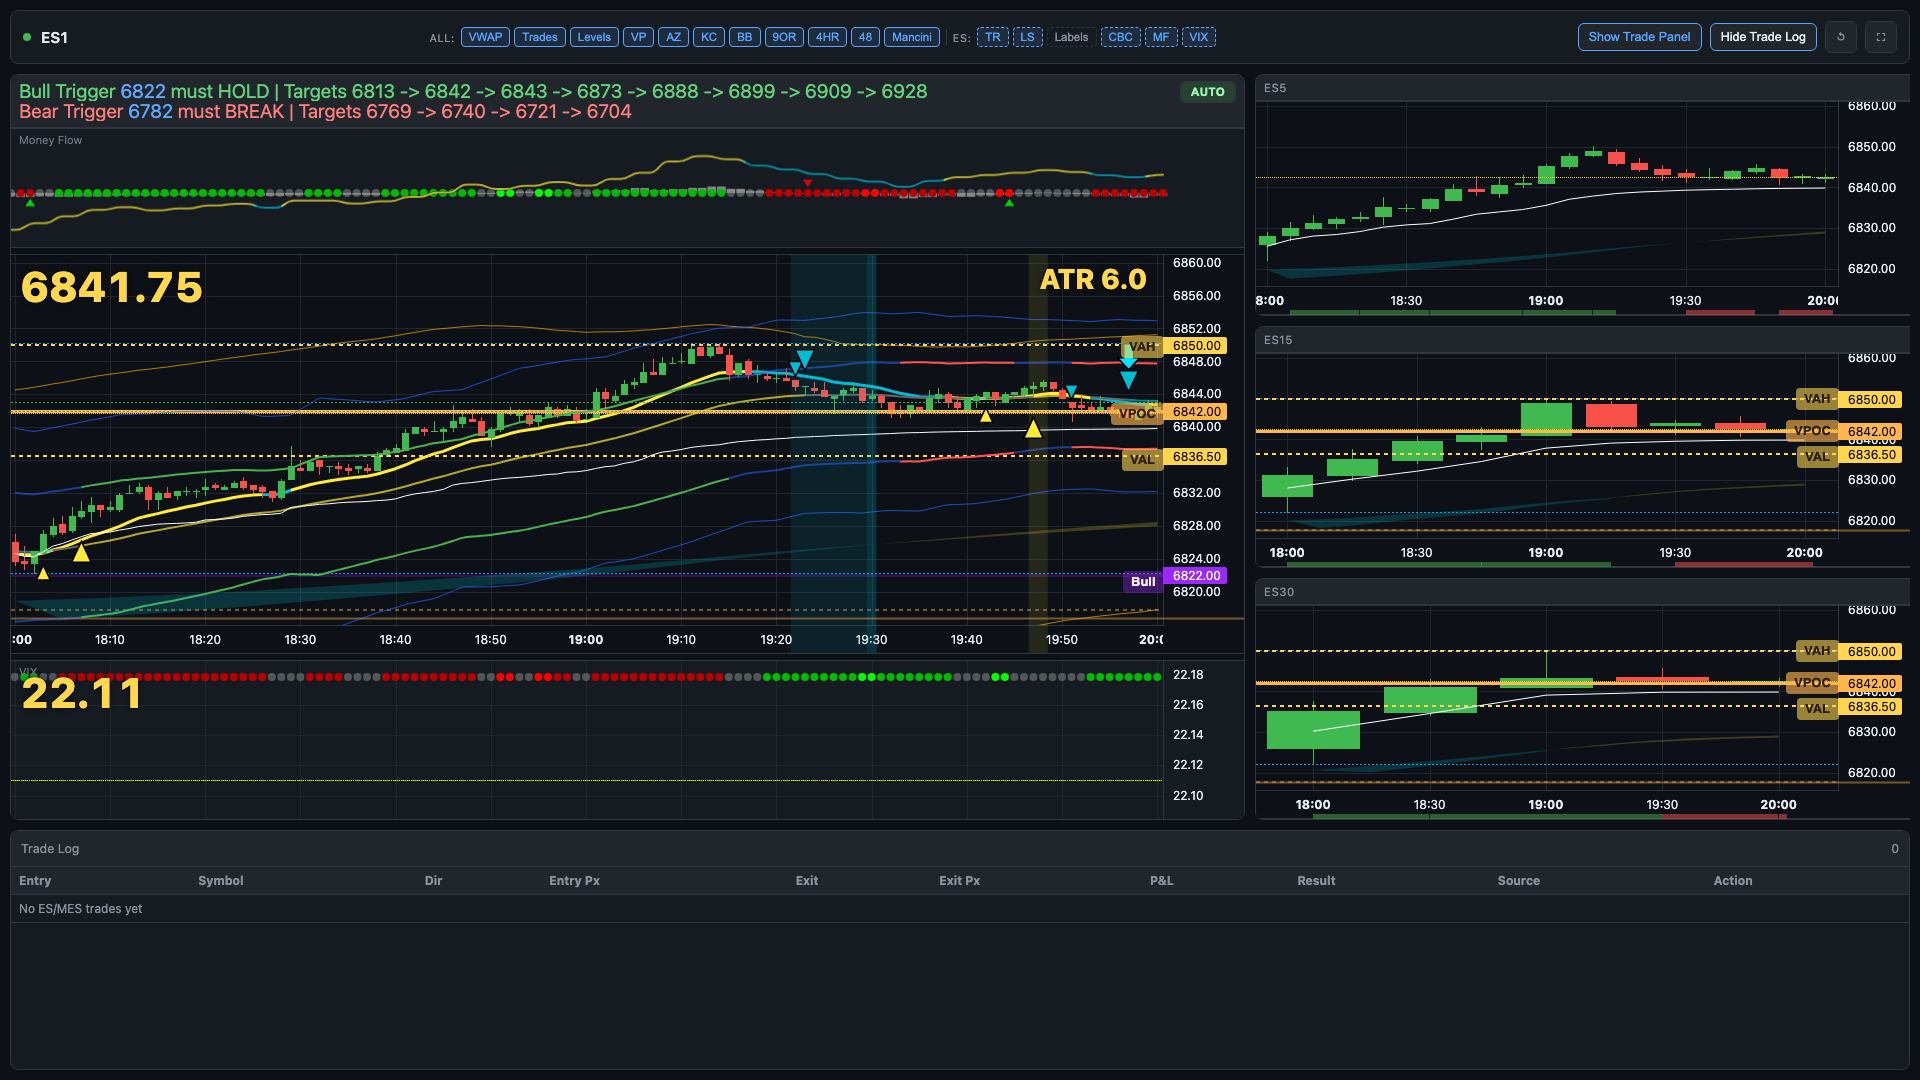
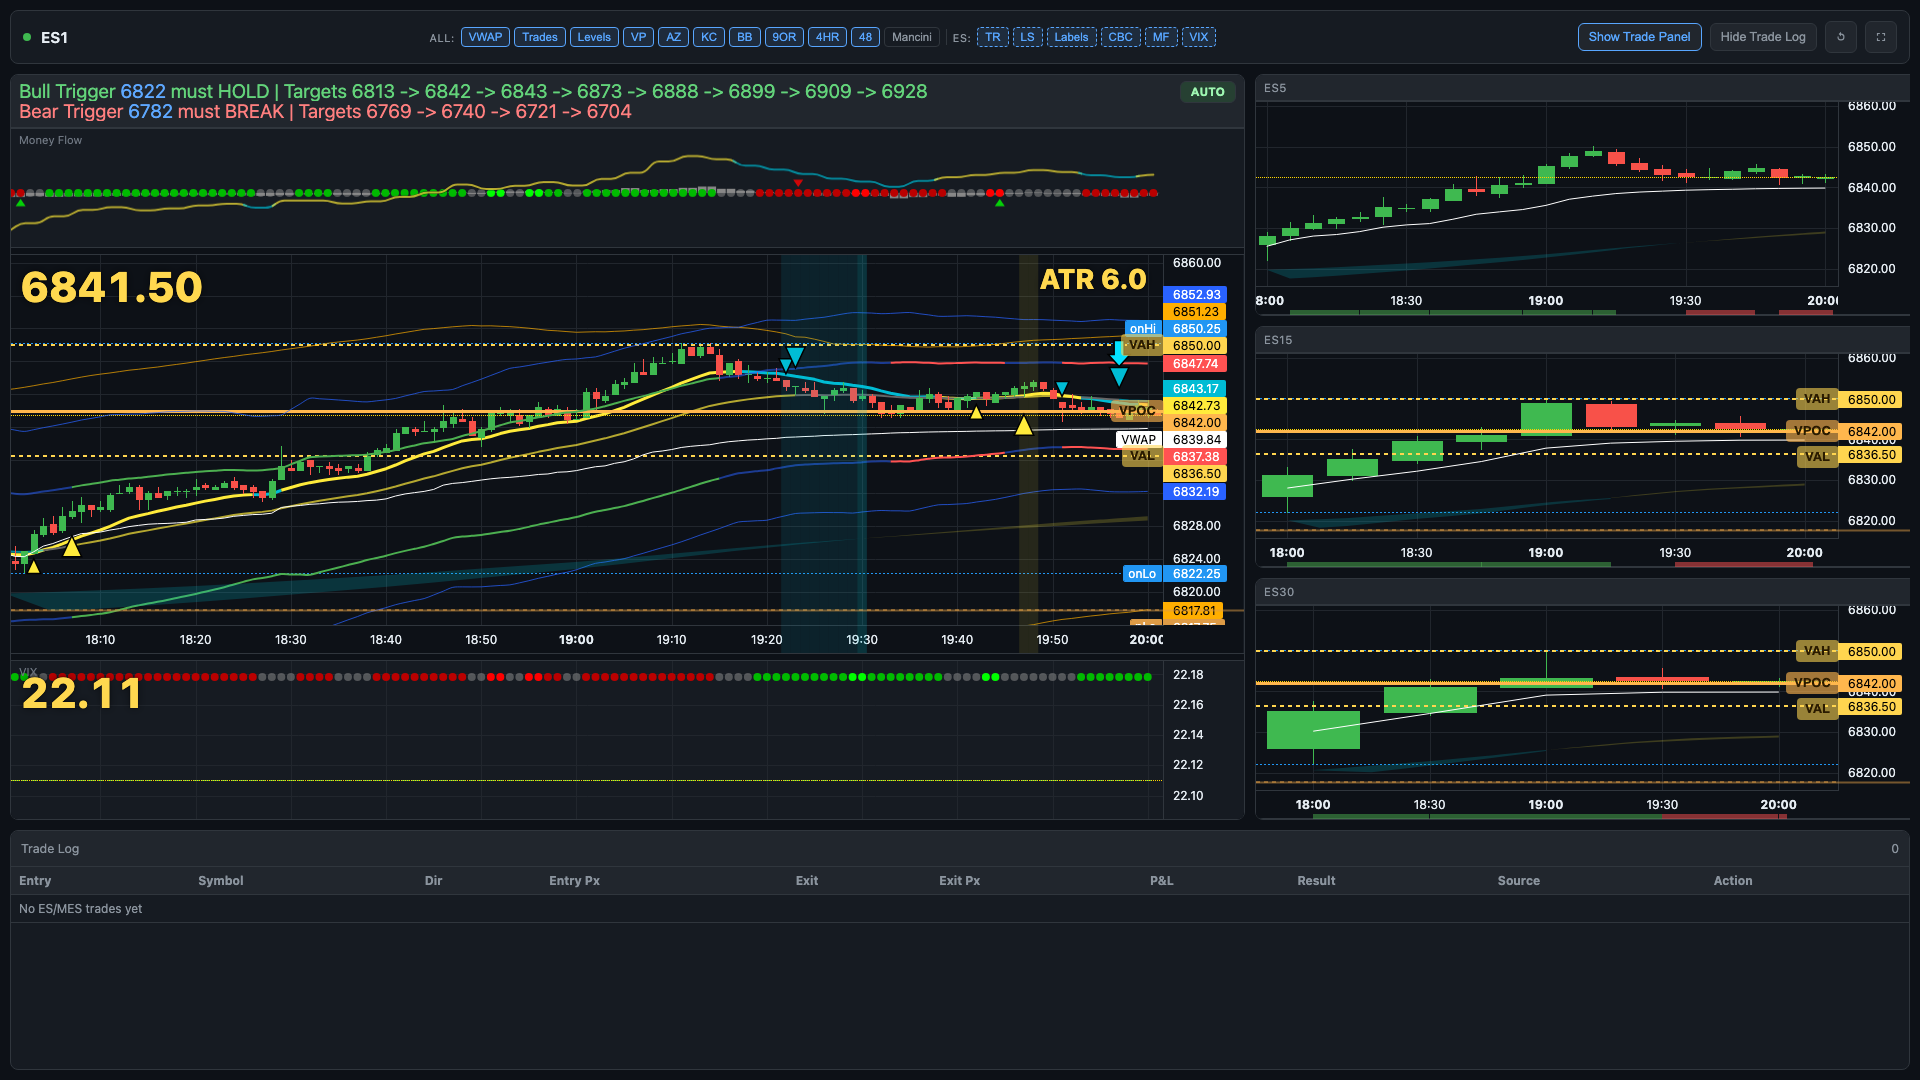
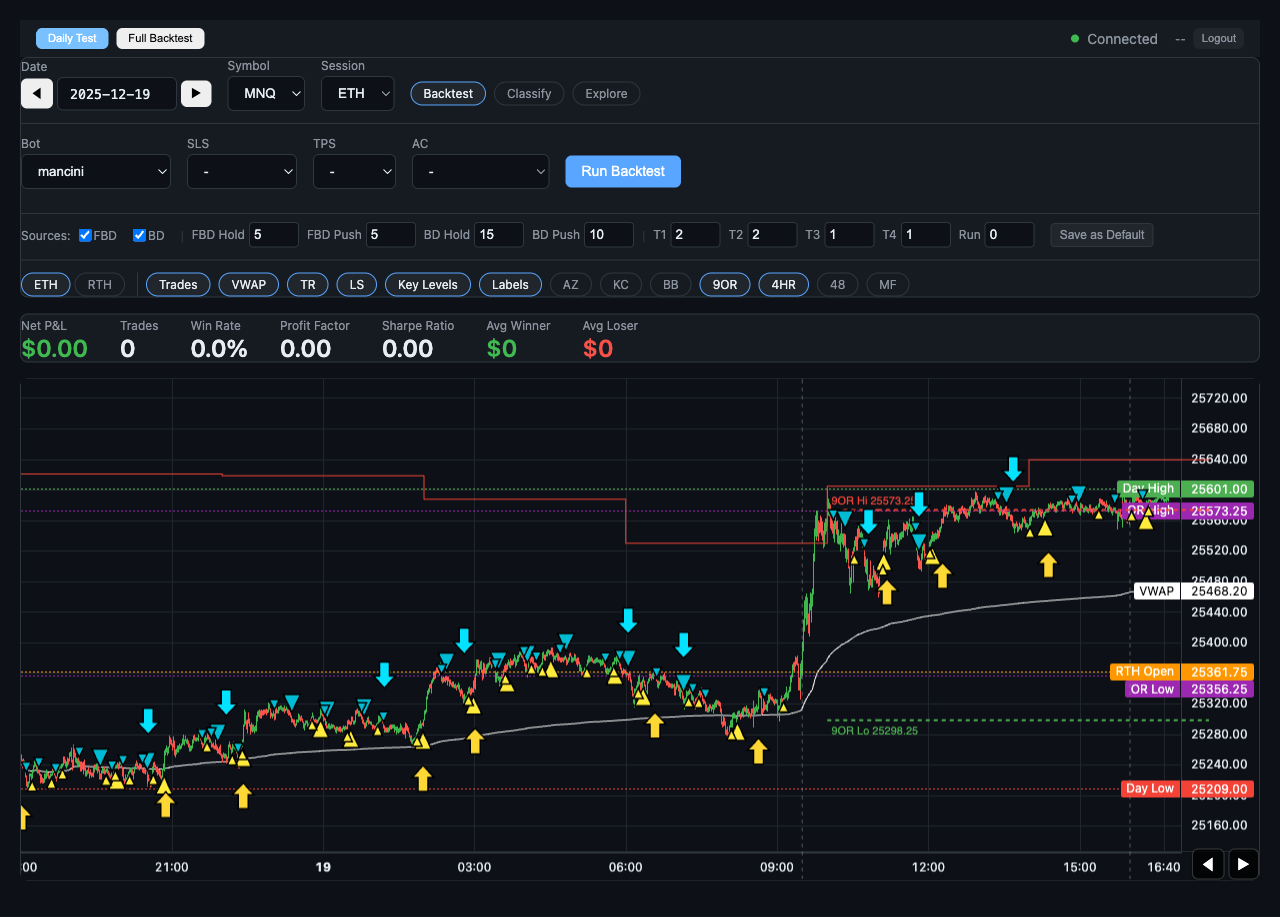
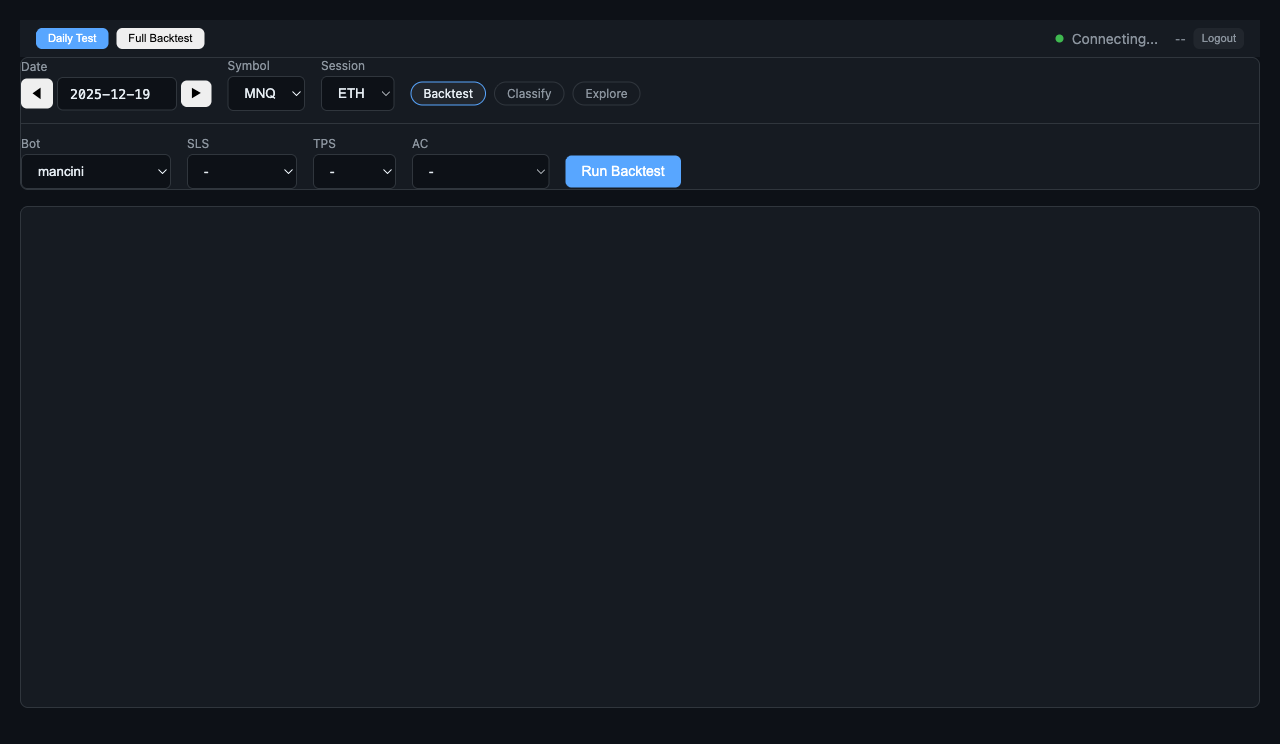
Screenshot Gallery
Chart States and Trade Management Screens
Live chart states captured from /portal/chart.html at 12:00 PM ET on a trading day.
Noon Trading-Day DefaultBaseline portal chart state at noon with full panel layout.Chart Focus ModeTrade panel hidden for a cleaner execution and structure view.Trade Log OpenNoon chart state with the lower trade log panel visible.Mancini + LabelsMancini levels and labels enabled to show alternate overlay context.MNQ Symbol ViewSame noon trading-day context after switching chart root symbol to MNQ.RTH Session ViewChart scoped to regular trading hours for cleaner intraday structure.Header ControlsIndicator toggles and chart actions captured from the live noon session.Main Panel Close-UpPrimary chart panel and overlays from the noon capture.Right Timeframe Stack5m/15m/30m right-column panels during the noon session.Chart Trader PanelOn-chart order controls captured directly from the live portal chart.Final ES Noon StateFull-screen ES capture from the noon trading-day run.Chart Loaded StateInitial loaded state showing indicator stack ready for the session.
Workflow
Simple Intraday Routine
Keep chart context, execution, and position management in one continuous loop.
1
Load Chart + Symbol
Open /portal/chart.html, pick your symbol and session scope, and confirm your indicator layout is ready.
2
Execute From Context
Use chart structure and live indicator readings to trigger entries directly — no separate execution panel needed.
3
Manage Risk In Place
Adjust stop and target, monitor position changes, and review trade history while keeping the chart front and center.
Why TradingPlace
One Screen Instead of Two
Most traders use a separate charting tool and a broker platform simultaneously. The context switch is where execution timing breaks down.
Chart App + Broker Platform (2 Apps)
Constant switching between chart window and execution platform
Execution timing misaligned from chart signal
Managing stops means leaving the chart view
Indicators in one app, orders in another
Two separate interfaces to configure and maintain
Position state not visible in chart context
TradingPlace Live Chart
Chart and execution in the same window
Enter directly off chart structure — zero context switch
Manage stop and target while keeping chart focus
Indicator stack, levels, and orders on one surface
One interface consistent with the rest of your workflow
Active position state visible alongside price action
FAQ
Frequently Asked Questions
Live chart trading access is included with the Gold plan and above. Crystal, Bronze, and Silver plans do not include access to /portal/chart.html. You can see the full feature breakdown on the pricing page.
Yes. The main Cockpit is account-centric — you manage multiple accounts, symbols, and signals from one dashboard. The live chart is chart-centric: a dedicated full-screen view built for reading price action and executing directly from indicator context. Both connect to the same live accounts and use the same execution infrastructure.
The chart includes the full TradingPlace indicator stack: trend ribbons, session VWAPs, key level overlays, FlowPulse panels, volume and momentum context, and Mancini level display. All indicators are the same ones used in the cockpit chart panels — toggleable from the chart header controls.
The chart is focused on one symbol at a time, but you can switch between symbols (ES, MES, NQ, MNQ, etc.) without leaving the chart view. Each switch reloads the indicator stack for the selected instrument. For multi-symbol group management, the main Cockpit is better suited.
Yes. Navigate to /portal/chart.html after signing in. You can also open it in a dedicated browser window or second monitor for a focused trading surface separate from your main cockpit session.
Yes. The chart supports ES, MES, NQ, MNQ, GC, and MGC. All supported symbols load with the same indicator stack and connect to the same live data feed. The screenshot gallery on this page shows both ES and MNQ captures from the same trading session.
RTH scope limits the chart x-axis to regular trading hours (9:30 AM – 4:00 PM ET), which removes overnight drift and gives you a tighter view of intraday structure and level reactions. Extended session shows the full 24-hour data. Most traders switch to RTH after the open for live session work and use extended session for overnight level context before the open.
Get Gold and Trade From the Chart
Gold unlocks live chart trading with the full indicator stack and on-chart execution.
Open the chart, read context, execute without switching apps, and manage risk from the same screen.